
Most parents are familiar with Growth Charts. Conversation-starters of “what centile is he on?” or “she’s always been on the XXXth” are rife within some parenting circles.
Growth charts can be a confusing and something that we take the time to thoroughly explain to all families that visit us in clinic. So, what do growth charts mean; should you be concerned if your child isn’t on the 50th percentile and when should further questions be asked?
Growth Charts 1-0-1
In Australia we use two main charts for growth and weight monitoring. For children under 2 years of age, The World Health Organisation (WHO) Charts should be used (easy to remember as “less than two, then use WHO”) then from 2 years of age, Centre Disease Control (CDC) Charts are used. There is gender-based charts for weight, length, height and body-mass-index (BMI) for age.
WHO Charts reflect how children who are breastfed, introduced solids between 4-6 months of age and receive complementary breastfeeding until 12 months of age grow. WHO charts are considered to be the best marker of how children should grow and are based on the growth patterns of children in countries from 5 continents.
CDC Charts reflect how children in The United States of America grew in the years between the 1960- 90’s. These charts are mainly reflective of formula fed infants and for some age groups were based on very small numbers of children. CDC Charts are considered to be markers of how children did grow, in one country when they were predominately formula fed.
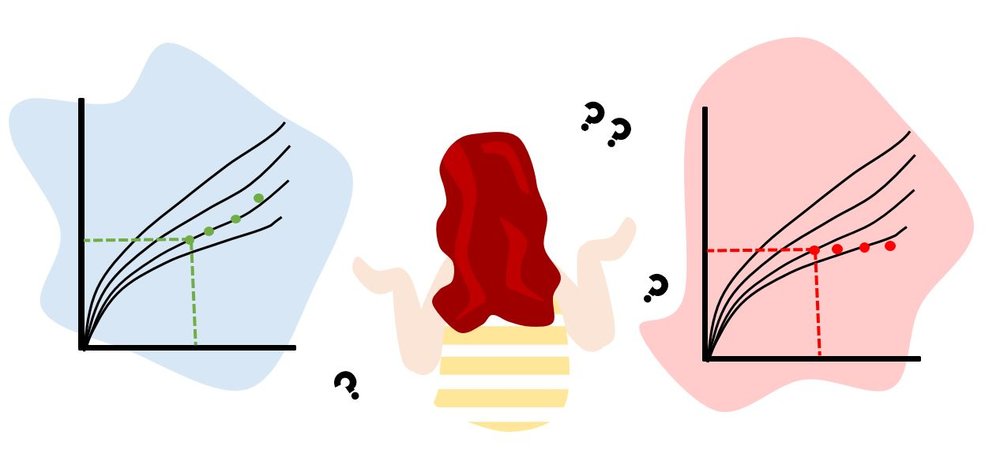
As there is quite a difference between WHO and CDC Charts it’s important to make sure the correct chart is being used for your child. This is important as a measurement on a CDC Chart may give a “false positive” suggesting poor growth or weight gains. This particularly shows around the 6 months of age mark. Whereas the same measurements on a WHO Chart may reflect adequate and appropriate growth and weight gains. Many of the computer systems that plot growth and weight gains that are used in GP Clinics automatically use CDC Charts. If this happens in your clinic, ask your Doctor or nurse for the figure and plot it into your child’s growth book for better accuracy.

What is the purpose of growth charts?
Growth and weight gains are influenced by many factors including nutrition, genetics, environment, health and wellbeing. When weight and length is regularly monitored and plotted onto charts it can allow for the early identification of poor (or excessive) growth. Early identification may allow for changes to be made in the influencing factors and overall, improve the health and wellbeing of the child.
It is important to remember that the purpose of growth charts is to compare individual growth and weight gains compared with a reference population. As such, individual variances must be considered and an appropriately trained health professional should help parents to understand what is “normal” in relation to their child.
How should growth and length be measured?
It is important to have accurate measurements before plotting these numbers onto a growth chart. An inaccurate measurement is sometimes hard to achieve (think a wriggly 4-month-old or crying 9-month-old) but is unhelpful and doesn’t allow for a good picture of the child’s health and wellbeing to be gained. For children under 2 years of age it is important to:
– Take a bare weight (this means nappy removed. Tip; work quick to avoid any accidents)
– Measure length laying down (Tip: pop the nappy back on before taking length)
– Ensure their head is fully to the end of the measuring board and foot is flexed to right angle.
Percentiles explained
Percentiles reflect how many children grew above or below the percentile range. Percentiles are based on a bell-curve system. This can be a bit confusing but simply put:
– 97% of children grew above the 3rd percentile
– 3% of children grew below the 3rd percentile
– 50% of children grew above the 50th percentile
– 50 % of children grew below the 50th percentile
Essentially, it doesn’t necessarily matter where the child sits within this bell curve IF
– They have displayed consistent growth and weight gains (sometimes called “tracking”)
– They have not increased or decreased percentile ranges
– Their weight and height are not 2 or more centiles apart
– Their BMI isn’t below the 3rd percentile or above the 85th percentile.
If your child’s growth charts display any of these they can be seen as a “Red Flag” and it would be a good idea to ask a few more questions to your doctor or a paediatric dietitian. A paediatric dietitian can assess factors that might be contributing to these “Red Flags” and give individual recommendations that may be favourable for the child’s growth or weight gains.
Key Points
– Serial measurements are important. They give a better picture of what growth and weight is expected of the child rather than just a comparison to a reference group
– There is a need for accurate measurements. Always take the time to gain a bare weight if < 2 years and ensure that the child is laying down (or standing if > 2 years)
– The 50th percentile isn’t necessarily the “goal” for all children.
– A child can be growing healthily if they are on the 3rd percentile (but probably best to check that this is their “normal”)
– Stick to one chart. Ideally WHO for < 2-year old’s and CDC from 2- 20 years.
– Growth charts provide important information about a child’s health and wellbeing. They should be interpreted with consideration of the individual child
– If there are concerns about growth or weight gains be it too little or too much, it’s generally best to seek the support of an appropriate health professional early rather than take a “Wait and see” approach.
Want to know more or concerned about your child’s growth or weight gains? Contact us to arrange an appointment.